Tuesday, June 16, 2015

Programming ATtiny85 MCUs using Usbasp programmer on Linux

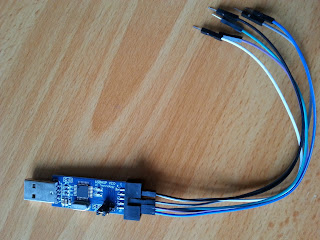
Usbasp programmer
Until recently, whenever I wanted to program an ATtiny85 chip, I used Arduino as ISP option about which I wrote in an earlier blog post. However, that is not a very convenient way of programming these tiny chips. Because of that, today I'm writing down the steps I followed to try programming ATtiny85 chips using a Usbasp programmer board. We can easily buy them for a very cheap price and no need of a huge effort to set it up for the programming job. In this post I will be doing everything on an Ubuntu 12.04 machine and will use Arduino IDE for the coding. I'm using a USBASP V2.0 board. I will list down the steps I used one by one. So, here we go.

(1) Connect the Usbasp programmer with ATtiny85 chip as shown in the picture. I will be using  a breadboard and few jumper wires for this connection.

Pin connections between Usbasp and ATtiny85
(2) Create a something.rules file in /etc/udev/rules.d. Add the following line into it.

SUBSYSTEMS=="usb", ATTRS{idVendor}=="16c0", ATTRS{idProduct}=="05dc", GROUP="users", MODE="0666"

(3) Now issue the command,

sudo service udev restart

(4) Now Arduino IDE can detect the USBASP programmer when it is connected to the USB port. From the tools menu, select the programmer Usbasp. From tools menu, select the board, "ATtiny85(internal 1MHz clock)".

(5) Program code for the blink program.


 1
 2
 3
 4
 5
 6
 7
 8
 9
10
11
12
13
14
15
16
17
18
19
/*
  Blink
  Turns on an LED on for one second, then off for one second, repeatedly.
 
  This example code is in the public domain.
 */
 
void setup() {                
  // initialize the digital pin as an output.
  // Pin 0 has an LED connected on most Arduino boards:
  pinMode(0, OUTPUT);     
}

void loop() {
  digitalWrite(0, HIGH);   // set the LED on
  delay(1000);              // wait for a second
  digitalWrite(0, LOW);    // set the LED off
  delay(1000);              // wait for a   
}

There will be a warning saying that, 'avrdude: warning: cannot set sck period. please check for usbasp firmware update'. We can simply ignore it.

(6) Now we can connect a LED in between ground and physical pin number 5
of the ATtiny85 chip will cause the LED to blick. In our program code in Arduino IDE, we mentioned the pin as 0 which actually represent the PB0 pin in the ATtiny85 chip. The PB0 pin is actually the physical pin 5.

ATtiny85 blinking a LED
References:

Tuesday, June 2, 2015

Audio Signals in GNURadio

Figure - 1
This time, I'm writing a very little note on how to handle audio signals using GNURadio. There are two basic things we can do. Firstly, we can take audio signals from a microphone in our computer and then visualizing it with various plot. Secondly, we can generate some signal within the audible frequency range and put it out using the speakers of our computer. In between those two options, we have the opportunity to manipulate signals and do whatever the processing we need to perform. Let's begin.

Figure - 2
Prepare a flow graph in GNURadio Companion (GRC) as shown in figure-1 where we just have two components, an Audio Source and a WX GUI Waterfall Sink. These two blocks together will extract the sounds from our computers microphone and show it as in a spectrogram. In is important to understand that we have set the sample rate to 48kHz which is the most commonly supported sample rate in audio devices in our computers. A configuration file for this flow graph setting can be found here. Running this flow graph will result in a beautiful spectrogram as shown in figure-2.

Figure - 3
Similarly, generating an audible sound and sending it to the speaker is also very easy. As shown in the flow graph of figure-3, we mainly need two components, a Signal Source and an Audio Sink. Our signal source generate signals in the sample rate of 48kHz as in the previous case. Instead of setting a predefined frequency for the signal source, we have added a WX GUI Slider which defines the frequency of the signal source. The configuration for this flow graph can be found here. Running this flow graph results in a tone which changes it's pitch as we move the slider to adjust the frequency. It is notable that when we increase the frequency beyond 20kHz, the sound goes out of our hearing as our ear is not sensitive to frequencies out of that boundary.

Signals against Noise in GNURadio

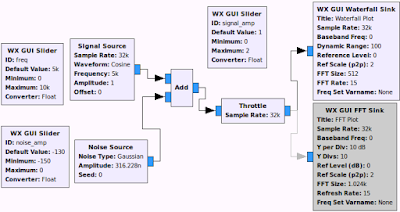
Figure - 1

In this article, I'm hoping to share a few more things I learned in GNURadio. To begin with, let's see what happens when a signal coming from a one source is mixed with another signal from another source. In particular, I'm adding a good signal with a noise generated from a noise source. Build the flow graph shown in figure-1 in GNURadio Companion (GRC) and it if needed, it's configuration file can be found here. You should notice that this time we are using three sliders, one to adjust the signal frequency, the second and third to adjust signal and noise amplitude. Our noise source is configured to generate some Gaussian noise in particular. We have plugged in a Waterfall sink and also an FFT sink. As you may have noticed in the flow graph, the FFT sink has become grey colored that means we have disabled that plot temporarily. We can enable and disable various blocks in the flow graph on the go. A block can be temporarily disconnected from the flow graph by right-click on the block and selecting 'disable' or 'enable' option. This option becomes handy where we need to try different parts of a flow graph without deleting the excess components which we may need later.

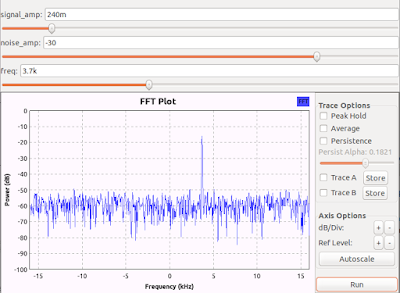
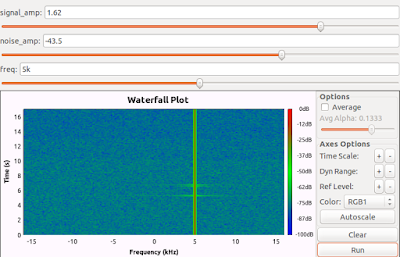
Figure - 2

Figure - 3

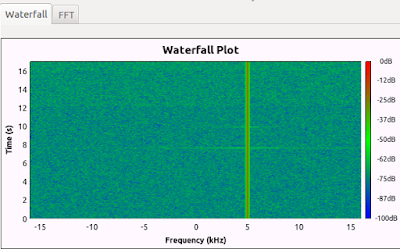
Running the flow graph with Waterfall sink and FFT sink separately results in plots shown in figure-2 and figure-3. Our three sliders will appear on top of the plots in each time. It is interesting to see how the increase of noise amplitude increases the noise floor making it's hard to find the signal. In figure-2, we can see a peak on top of the noise floor which is the signal. Similarly in figure-3, we can see a bright line which represent the signal. In this example, we had to enable and disable the two plots in order to view them separately. If we set them to display at the same time, sometimes the size of our screen may not be enough and most parts of the GUI windows will go out of the visible screen space. But, we have a solution for this which I explain in the next step.

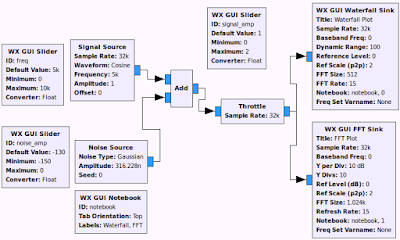
Figure - 4

In order to easily view different GUI components such as FFT, Scope and Waterfall plots, we can arrange them into tabs in the window. For this purpose, first we should add a block called WX GUI Nootebook. Let's say we have to GUI plots currently in the flow graph which are a Waterfall Sink and an FFT sink. Double-click on the WX GUI Notebook block and in the 'Labels' field, add the content as ['Waterfall','FFT']. Set the ID field as Notebook. Now, double-click on the WX GUI Waterfall Sink block and in it's Notebook field, add the line notebook,0. Similarly, open the WX GUI FFT Sink block and in the Notebook field, add the line notebook,1. An example flow graph is shown in figure-4 and it's configuration file can be found here. Now, when we run the flow graph, we should be able to view the plots separately on different tabs as shown in figure-5. This is more convenient than displaying GUI components separately.

Figure - 5
That's it!

Hands-on GNURadio Companion

As I mentioned in my previous article, I started to explore a whole new field of software defined radios (SDRs) which I came across about a month ago. Initially it started as a requirement of learning digital signal processing (DSP) which is definitely important in my research works. While going through DSP stuff, I came across this wonderful world of SDRs and now I'm taking baby steps into the SDR world. When using SDR hardware tools, the knowledge of SDR software such as GNURadio is inevitable. GNURadio is an opensource software defined radio tool set that is being widely used by the people in this domain. The purpose of this article is to note down some of the basic stuff I learned today about using GNURadio to process signals.

Before everything, we need GNURadio software environment up and running in my system. To avoid the installation hassles, I prefer booting my system using a USB drive with a live Linux image which are readily available from here. GNURadio software tools are pre-installed in such Linux images to make our lives easier. After booting the system with GNURadio, we can launch GNURadio Companion (GRC) tool which provide facility to visually create flow graphs that consists of different blocks. These blocks can be either signal sources, signal sink or signal processing components. An important thing to check after starting GRC for the first time is double-clicking on the 'Options' block and going to the 'General Options' field which should be set to 'WX GUI'. Setting it to some other thing from the drop down list can cause various run-time problems which I had to learn in the hard way. After setting this option, we are ready to start our adventure.

Figure - 1

Figure - 2

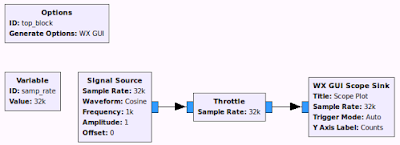
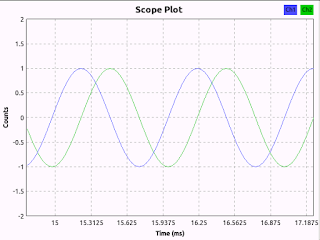
As our first exercise, we generate a signal and visualize it with various plots available in GNURadio. Drag and drop the relevant components from right-hand side list and create a flow graph like the one shown in Figure-1. This flow graph can be downloaded from here too. Signal Source block is used to generate the signal we want. Double-click on it and see how its settings are placed. The task of the throttle block is to control the rate of samples flowing through the flow graph. The last block in the flow graph WX GUI Scope Sink draws a graph which will show us the waveform of the generated signal. Clicking on the play button on the tool bar cause the flow graph to be compiled and generate a python script. Then this python script will start to run automatically. The resulting Scope plot window is shown in Figure-2
Figure - 3

Figure - 4

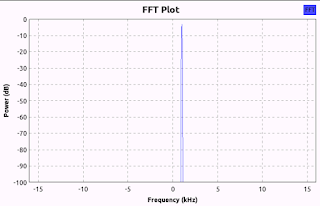
After looking at the waveform, now let's draw an FFT plot for the signals generated using Signal Source. For that, we should delete the previous sink and add a WX GUI FFT Sink block. This new flow graph is shown in Figure-3 and the source file for this new flow graph can be found here. It is important to double-click on this FFT block and look at how it's configurations are made in order to make it work. When we run this flow graph,  the FFT block will show up which has frequency in it's x-axis as shown in figure-4. Y-axis of the graph shows the power of each frequency component in dB units. As our signal source is set to 1kHz, FFT plot shows a peak at that frequency.

Figure - 5

Figure - 6

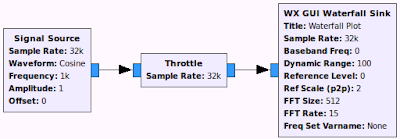
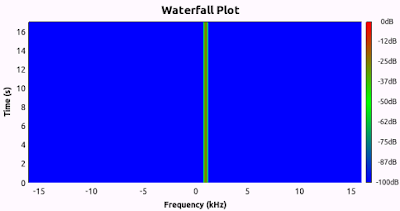
Now we explored two types of plots to visualize our signals from the source block. It's time to learn another kind of plot that is WX GUI Waterfall Sink block. It works like a spectrogram showing the power variation of various frequency components over time. Remove the previous sink block and add such a sink block in to the place as shown in figure-5. A configuration file for such a flow graph can be found here. When we run this flow graph, it shows a beautiful plot which update over time as depicted in figure-6. Among all the other plot types, I like these Waterfall plots so much since it provides a lot of information about the signals being watched.


Figure - 7

Figure - 8

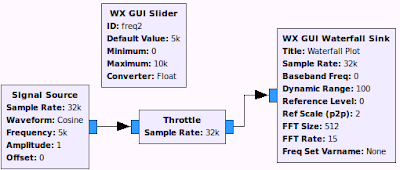
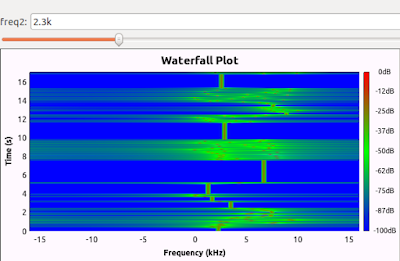
As the last thing I share in this article, let's look at how we can dynamically adjust a specific parameter in the flow graph while it is running. For this purpose, we need to employ a WX GUI Slider block. For the ID field of this block, we put a name freq2 and then in the signal source block, we should set frequency field to freq2 variable. Such a setting is shown in figure-7 and a suitable configuration file for such a flow graph can be found in here. When we run this flow graph, we get a waterfall plot together with a slider which can be adjusted to change the frequency of the signals generated from the source block as shown in figure-8. 

That's all for this first article about using GNURadio. I will write a few more articles with various other things I learn in GNURadio territory. Cheers!!