Tuesday, June 2, 2015

Signals against Noise in GNURadio

Figure - 1

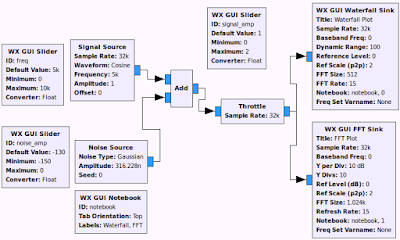
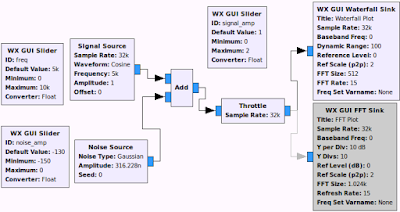
In this article, I'm hoping to share a few more things I learned in GNURadio. To begin with, let's see what happens when a signal coming from a one source is mixed with another signal from another source. In particular, I'm adding a good signal with a noise generated from a noise source. Build the flow graph shown in figure-1 in GNURadio Companion (GRC) and it if needed, it's configuration file can be found here. You should notice that this time we are using three sliders, one to adjust the signal frequency, the second and third to adjust signal and noise amplitude. Our noise source is configured to generate some Gaussian noise in particular. We have plugged in a Waterfall sink and also an FFT sink. As you may have noticed in the flow graph, the FFT sink has become grey colored that means we have disabled that plot temporarily. We can enable and disable various blocks in the flow graph on the go. A block can be temporarily disconnected from the flow graph by right-click on the block and selecting 'disable' or 'enable' option. This option becomes handy where we need to try different parts of a flow graph without deleting the excess components which we may need later.

Figure - 2

Figure - 3

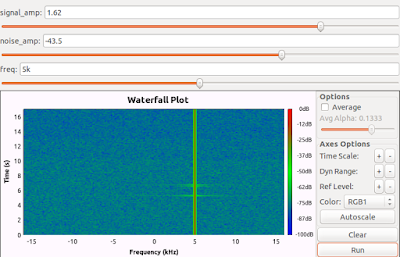
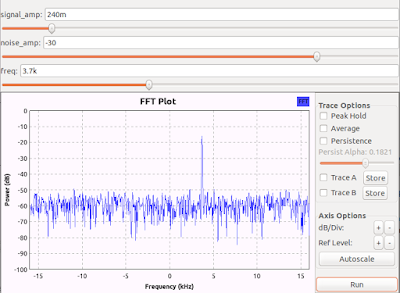
Running the flow graph with Waterfall sink and FFT sink separately results in plots shown in figure-2 and figure-3. Our three sliders will appear on top of the plots in each time. It is interesting to see how the increase of noise amplitude increases the noise floor making it's hard to find the signal. In figure-2, we can see a peak on top of the noise floor which is the signal. Similarly in figure-3, we can see a bright line which represent the signal. In this example, we had to enable and disable the two plots in order to view them separately. If we set them to display at the same time, sometimes the size of our screen may not be enough and most parts of the GUI windows will go out of the visible screen space. But, we have a solution for this which I explain in the next step.

Figure - 4

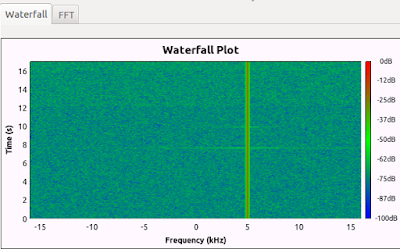
In order to easily view different GUI components such as FFT, Scope and Waterfall plots, we can arrange them into tabs in the window. For this purpose, first we should add a block called WX GUI Nootebook. Let's say we have to GUI plots currently in the flow graph which are a Waterfall Sink and an FFT sink. Double-click on the WX GUI Notebook block and in the 'Labels' field, add the content as ['Waterfall','FFT']. Set the ID field as Notebook. Now, double-click on the WX GUI Waterfall Sink block and in it's Notebook field, add the line notebook,0. Similarly, open the WX GUI FFT Sink block and in the Notebook field, add the line notebook,1. An example flow graph is shown in figure-4 and it's configuration file can be found here. Now, when we run the flow graph, we should be able to view the plots separately on different tabs as shown in figure-5. This is more convenient than displaying GUI components separately.

Figure - 5
That's it!

Hands-on GNURadio Companion

As I mentioned in my previous article, I started to explore a whole new field of software defined radios (SDRs) which I came across about a month ago. Initially it started as a requirement of learning digital signal processing (DSP) which is definitely important in my research works. While going through DSP stuff, I came across this wonderful world of SDRs and now I'm taking baby steps into the SDR world. When using SDR hardware tools, the knowledge of SDR software such as GNURadio is inevitable. GNURadio is an opensource software defined radio tool set that is being widely used by the people in this domain. The purpose of this article is to note down some of the basic stuff I learned today about using GNURadio to process signals.

Before everything, we need GNURadio software environment up and running in my system. To avoid the installation hassles, I prefer booting my system using a USB drive with a live Linux image which are readily available from here. GNURadio software tools are pre-installed in such Linux images to make our lives easier. After booting the system with GNURadio, we can launch GNURadio Companion (GRC) tool which provide facility to visually create flow graphs that consists of different blocks. These blocks can be either signal sources, signal sink or signal processing components. An important thing to check after starting GRC for the first time is double-clicking on the 'Options' block and going to the 'General Options' field which should be set to 'WX GUI'. Setting it to some other thing from the drop down list can cause various run-time problems which I had to learn in the hard way. After setting this option, we are ready to start our adventure.

Figure - 1

Figure - 2

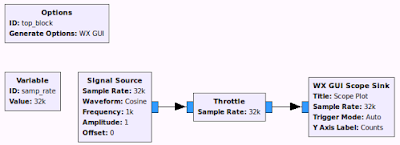
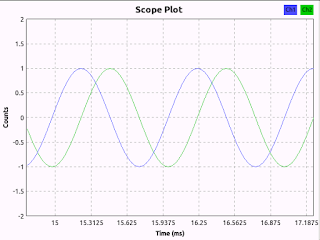
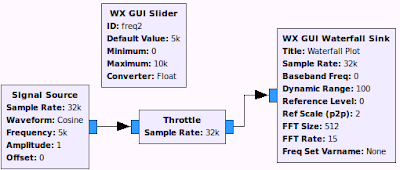
As our first exercise, we generate a signal and visualize it with various plots available in GNURadio. Drag and drop the relevant components from right-hand side list and create a flow graph like the one shown in Figure-1. This flow graph can be downloaded from here too. Signal Source block is used to generate the signal we want. Double-click on it and see how its settings are placed. The task of the throttle block is to control the rate of samples flowing through the flow graph. The last block in the flow graph WX GUI Scope Sink draws a graph which will show us the waveform of the generated signal. Clicking on the play button on the tool bar cause the flow graph to be compiled and generate a python script. Then this python script will start to run automatically. The resulting Scope plot window is shown in Figure-2
Figure - 3

Figure - 4

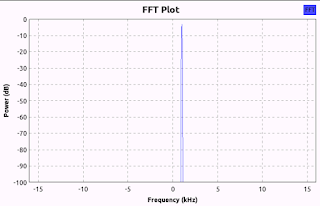
After looking at the waveform, now let's draw an FFT plot for the signals generated using Signal Source. For that, we should delete the previous sink and add a WX GUI FFT Sink block. This new flow graph is shown in Figure-3 and the source file for this new flow graph can be found here. It is important to double-click on this FFT block and look at how it's configurations are made in order to make it work. When we run this flow graph,  the FFT block will show up which has frequency in it's x-axis as shown in figure-4. Y-axis of the graph shows the power of each frequency component in dB units. As our signal source is set to 1kHz, FFT plot shows a peak at that frequency.

Figure - 5

Figure - 6

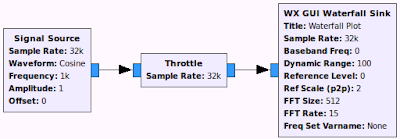
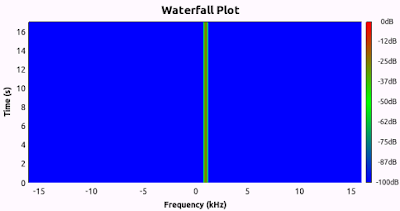
Now we explored two types of plots to visualize our signals from the source block. It's time to learn another kind of plot that is WX GUI Waterfall Sink block. It works like a spectrogram showing the power variation of various frequency components over time. Remove the previous sink block and add such a sink block in to the place as shown in figure-5. A configuration file for such a flow graph can be found here. When we run this flow graph, it shows a beautiful plot which update over time as depicted in figure-6. Among all the other plot types, I like these Waterfall plots so much since it provides a lot of information about the signals being watched.


Figure - 7

Figure - 8

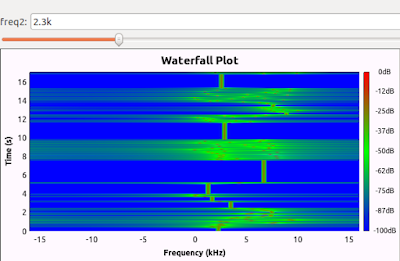
As the last thing I share in this article, let's look at how we can dynamically adjust a specific parameter in the flow graph while it is running. For this purpose, we need to employ a WX GUI Slider block. For the ID field of this block, we put a name freq2 and then in the signal source block, we should set frequency field to freq2 variable. Such a setting is shown in figure-7 and a suitable configuration file for such a flow graph can be found in here. When we run this flow graph, we get a waterfall plot together with a slider which can be adjusted to change the frequency of the signals generated from the source block as shown in figure-8. 

That's all for this first article about using GNURadio. I will write a few more articles with various other things I learn in GNURadio territory. Cheers!!

Sunday, May 24, 2015

Expeditions with Software Defined Radios (SDRs)

I have been working with wireless networks and related stuff for several years. However, in all those works, I was working with radio transceivers which are dedicated to a particular standard or a protocol specification. Such a radio transceiver covers the communication protocol stack from the physical layer up to some significant parts of the data-link layer in many systems. Software implementations cover the rest of the protocol stack and has a very little control over the hardware controlled bottom most functionality. That is why we have to change the radio transceiver hardware in every time we need to switch from one wireless standard to another. Simple changes in software does not help in most cases. This is where, software defined radios (SDRs)  comes into play a role.

Scientists and engineers who are working in developing new wireless communication technologies and standards have to continuously perform experiments with their designs in order to evaluate and fine tune them. They cannot fabricate a new radio transceiver chip in every time they want to test a slightly changed design. They need something easier to change and play with that gives the same functionality as real and technology specific radio transceivers. A software defined radio (SDR) is a combination of a special radio hardware and a software tool which completely revolutionize the way we play with wireless medium. SDRs have moved many of the hardware oriented functionality into the software layer in such a way that makes the user to switch between different wireless technologies easily. We can easily configure an SDR to use a specific frequency, modulation technique and various other things making it whatever we want. Hardware part of an SDR simply perform ADC and DAC conversions of the wireless signals and let the software to handle everything else making it extremely flexible.

When considering SDRs, we have to discuss about two things that are SDR hardware and various available SDR software. One of the most important software toolkit for SDR works is GNURadio. It is a free and opensource tool which supports various SDR hardware devices which we can find in this list. Among those, USRP devices from Ettus research are the most expensive but most powerful hardware according to what I have read. The simplest and easy to acquire devices are rtl-sdr dongles which are widely available as digital TV receivers. HackRF is a device which provide great functionality for most SDR based experiments which has a moderate price than USRP devices. Recently, we received a HackRF One device to our lab which significantly increased our capability to perform wireless research works. I would like to leave this article with a little note on the steps I followed on my first experience with HackRF One device. I created a simple FM radio receiver and was able to listen to FM radio stations. I learnt about this example from Michael Ossmann, the inventor of HackRF device who has a very nice website that provide so many useful information and learning materials.


Here is how I did it. First of all, I need to have GNURadio running in my system. Since I found installing GNURadio on a Linux system very complicated and tiresome, I decided to use a GNURadio pre-installed live Linux image to boot my computer and work. Various options are available to this end as you can find from the following link. I downloaded an Ubuntu 14.04 image with GNURadio version 3.7.6.1 pre-installed and then made my USB drive bootable with it by using the Ubuntu Statup Disk Creator tool available on my Ubuntu machine. After booting the system with the USB we are good to go. It's time to open the provided configuration file for an FM radio receiver using GNURadio Companion (GRC) tool. You can download the configuration file from here. After opening it from GRC tool, plugin the HackRF One device via the USB connector and simply click the play button to execute the flow graph. Now, you should be able to listen to FM radio stations by tuning with the slider.

I have a long way to go to be able to use this combination of hardware and software for advanced SDR works. I'm already impressed by these wonderful gadgets and I can't wait to see what I can do with them more.

~****~

Creating a password protected directory in Apache2 server

While working on some assignment preparation for a networking course, I wanted to create a password protected directory inside Apache2 server's webroot directory. Even though this is something straightforward and many people have documented it, still I faced many difficulties while trying to configure it. Therefore I decided to note down the steps for my own future use. So, here we go.

Login to the web server and take the following steps.

cd /var/www/
sudo mkdir test-directory
cd test-directory/
sudo nano protected-file.txt

This is the file which we will protect. For the moment, just enter some text inside this file and save it. Now we create another important file inside this directory as follows.

sudo nano .htaccess

The content of this file should be as shown below. The path should be placed according to where we will place the .htpasswd file in later steps.

AuthUserFile /path/to/our/password/.htpasswd
AuthType Basic
AuthName "My restricted Area"
Require valid-user

Now let's move out and change some access privileges.

cd ../
sudo chmod 777 -R test-directory/

Now we should go to the place we decided to create the password file.

cd /path/to/our/password/
sudo nano .htpasswd

Enter the uname  and password line inside this file. We can use some online tool to generate the content of this file based on the username and password we are going to use. One such an online tool is this. Then let's provide permission for this directory too. Finally we should restart the apache2 server.

chmod 777 -r /path/to/our/password/
sudo /etc/init.d/apache2 reload

Now we can go to the password protected directory using the web browser which will prompt for the username and password before allowing to view the content of that directory.

References:
[1] https://help.ubuntu.com/community/EnablingUseOfApacheHtaccessFiles
[2] http://www.web2generators.com/apache-tools/htpasswd-generator


Saturday, May 2, 2015

Listening to the Giants

Our infra-sonic recording setup
Elephants are very important type of animals in our world as they are the giant mammals living on the surface of the Earth. I'm so lucky to have elephants in my country which is not an opportunity everybody get. Some people in this world have to visit a zoo to see this kind of a giant mammal while we have a lot of them in our wildlife reservoirs. In addition to the wild elephants, there are many domesticated elephants owned by different people. The most popular national event that features elephants is the Kandy Perahera where many elephants walk along the traditional dancers and other cultural displays.

We, as a research group, developed our interest on elephants due to their involvement in very important problems in our society. Wild elephants have become an unavoidable factor in the daily life of a lot of rural people in Sri Lanka as they experience conflicts between humans and elephants very often. Such events have resulted in deaths of both humans and elephants in addition to huge financial losses created by elephant attacks to crops and human habitats. Another important thing that draws our attention is the collisions between wild elephants and locomotives that carry passengers and goods through rural areas specially in the northern and central part of the island. All these things highlight the importance of studying elephants to find smart ways to mitigate their problems. In particular, we are interested on the communication of elephants based on infra-sounds which is not sensitive to the human ear. If we gain a capability to detect their communication, we might be able to do to various useful things such as locating them in the jungle, protecting humans from their raids, etc.

Preparing for the experiment
Aligned with this goal, we have conducted several studies on infra-sound emitted from wild elephants and last Thursday we made another step along this path. We received an opportunity to perform a recording near a domesticated elephant. Unlike any other elephant which we may have encountered, our recent visit was to the single most important elephant of our country. That is the Tusker which holds the Tooth Relic at the Kandy Perahera. They call it Nedungamuwe Raja which lives near its owners house in the village called Nedungamuwa in Gampaha District. As we heard, this one is the tallest domesticated elephant in South Asia. It was born in India and handed to a monk in Sri Lanka by a Maharaja. Currently it belongs to an Ayurvedic physician.

Well, that's me :)
Three people from our lab that is Poshitha, Chathura and me joined for this visit. We carried our infra-sonic recorder device with a video camera and a laptop. The two persons who are in-charge of taking care of the elephant was so helpful during our work. We set up the infra-sonic recorder and video camera on a tripod and connected it to the laptop near the elephant. We waited for about an hour to collect as much data as possible. Since we were just recording the sound and taking video, we didn't have to disturb the elephant on its daily routine. It was eating all the time during the recordings. We bought some fruits from a nearby shop and offered to the elephant too. After the recordings, the owners family offered us some refreshments with sweets and cold beverages at their house. Their kind help was so important to us to get this work done. It was a wonderful experience since it's usually not easy to see the tusker which carries the Tooth Relic in this form outside the Perahera in Kandy.

We still don't know whether the recorded data has some indication of the presence of infra-sonic emitted by the elephant. Poshitha will need more time to analyze those data and extract what we want. Whatever the result would be, I'm so happy about this field visit which was a very nice experience that makes research more interesting than sitting in a lab in front of a computer.
~******~

Wednesday, April 29, 2015

New Areas and New Experiences

Last two months have brought me a lot of new knowledge and exposures on completely unexpected things. First of all, I received some opportunities to conduct some teaching in courses such as Wireless Sensor Networks, Computer Networks and Information Security. As teaching is something that fascinates me always, I never miss an opportunity to teach something to somebody. I think these little teaching experiences will pay me off one day to become a great teacher. In addition to teaching, I'm the guy who handles the lab practicals for Wireless Sensor Networks course. 

Above all these things, I got the chance to put my mind on some really great stuff in research. I have started to co-supervise two final year undergraduate projects together with Dr. Chamath. One work is related to a new kind of sensor network architecture which came into our mind after closely studying the recent trends in wireless sensor network world. The second project is a Radio Tomographic Imaging (RTI) work which is a completely new thing to me. It involves using small low cost radio transceivers and some mathematics. We are still in the early stage of these works but the things seems interesting so far. In addition to these two final year research projects, two postgraduate students of Dr. Chamath are involved in two interesting works which made me to involve in their work too and that is solely because of my personal interest. Their works involves software defined radios (SDRs) and some sophisticated mathematical analysis stuff. 

Because of the requirements of research works, I have started to follow Digital Signal Processing (DSP) subject. I had never learnt things on that area and therefore I had to start from the beginning. One great book suggested by Dr. Chamath regarding DSP subject is The Scientist and Engineer's Guide to Digital Signal Processing By Steven W. Smith. This book is available online for free download from here. This book explains the subject matter in a very simple way minimizing the mathematical jargon which may discourage an armature reader of those topics. Additionally, I have started to learn GNU Radio which is a very powerful software defined radio tool used by everybody in the domain. These days we are waiting for some SDR hardware devices to arrive which we ordered. Once those stuff arrived, the knowledge of DSP and SDR will be highly necessary to proceed in our research work.

Saturday, April 4, 2015

Extraterrestrial view of our island

This morning, I saw this picture taken about two weeks ago by a NASA astronaut called Terry Virts (@AstroTerry) who is in International Space Station (ISS) at the moment. I couldn't help myself from putting a little note about it. Looking at our planet from the space is an enlightening experience for humans which shows how insignificant our problems are in this small lifetime. That experience becomes much more fascinating when we see our small island in the vast planet surface. Last night I was working till late on my computer and made me to wake up late. However, after waking up in this morning, seeing this picture made my day in a great way.

~*****~